What are shares?
Shares represent units of ownership in a company. When you purchase shares, you become a partial owner (shareholder), entitling you to dividends and voting rights.
What are Primary & Secondary Market?
Primary Market is where new stocks are created (IPO). Secondary Market is where investors trade existing shares on exchanges like NSE and BSE.
What is IPO?
Initial Public Offering (IPO) is the process by which a private company sells its shares to the public for the first time to raise expansion capital.

What is a bonus issue?
Free additional shares given to existing shareholders in a fixed ratio, issued using the company's accumulated profits and reserves.
What is stock split?
A company divides its existing shares into multiple shares to lower the price and increase liquidity, without changing total market value.

What does SENSEX, BSE, NSE?
BSE and NSE are India's major stock exchanges. SENSEX is the benchmark index for BSE, representing the top 30 stable companies.
What is intraday trading?
Buying and selling stocks within the same business day to profit from short-term price movements before the market closes.
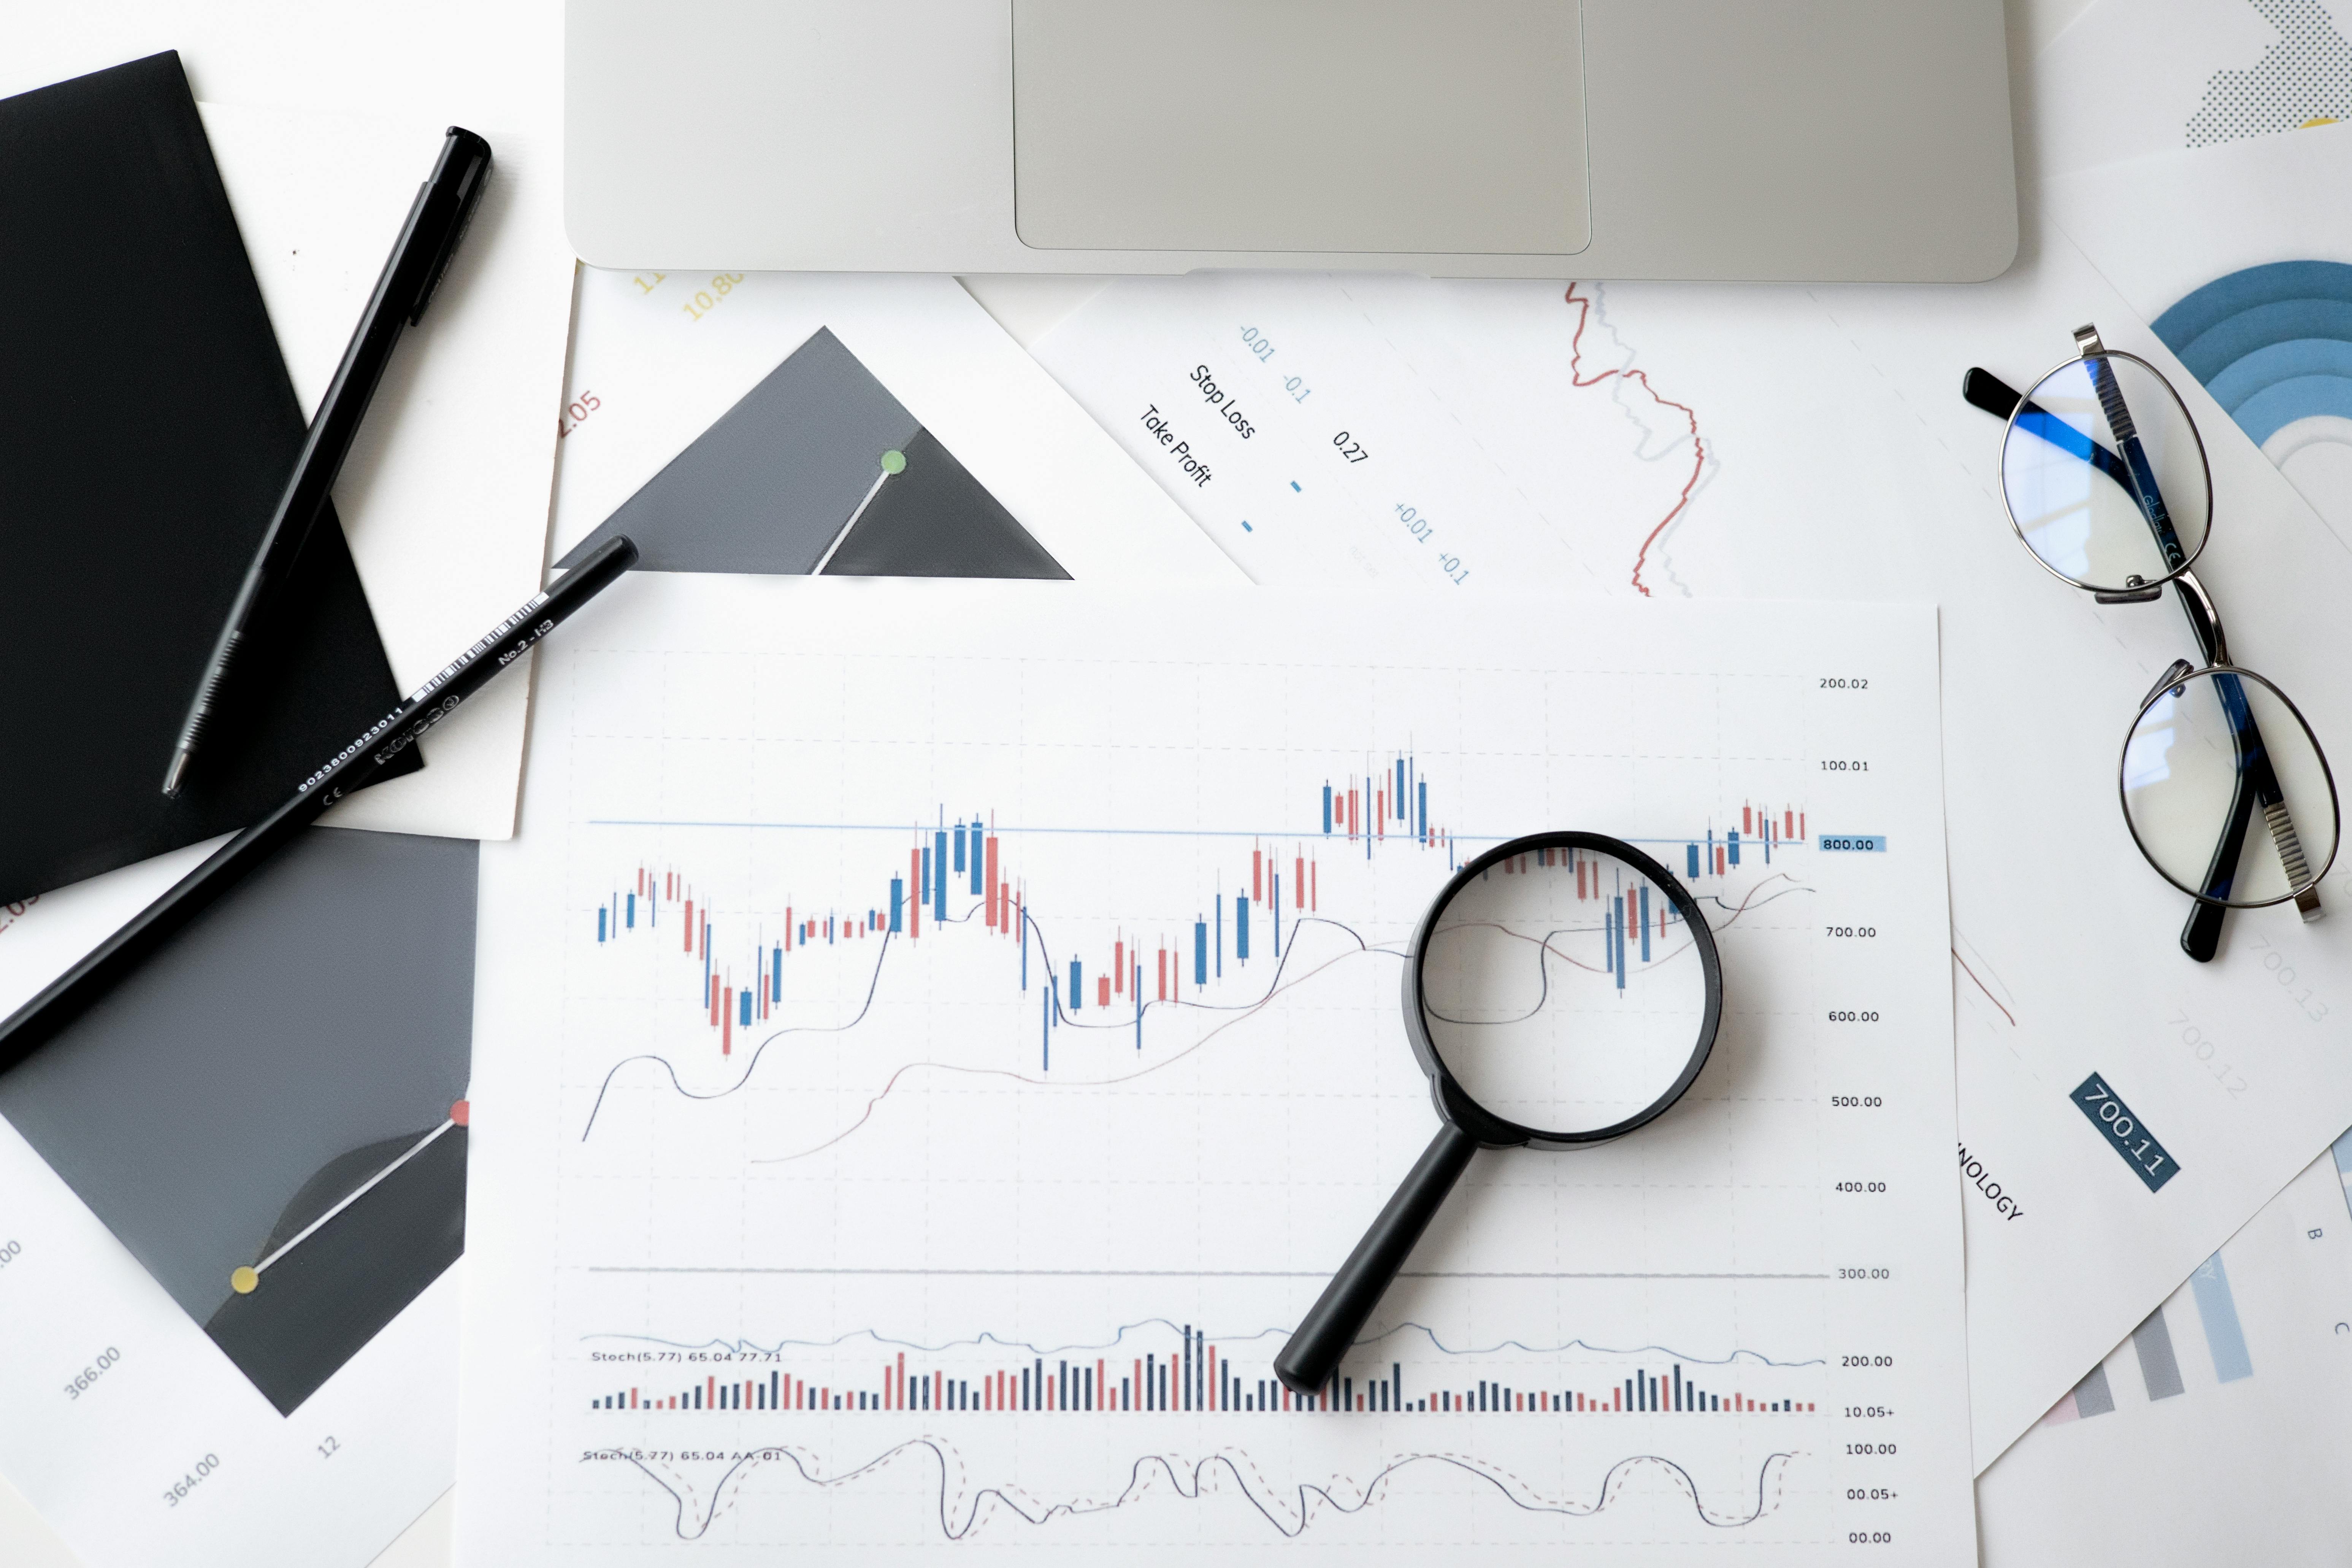
What is stop loss?
An automated instruction to sell a security when it reaches a specific price point, vital for limiting potential losses in high volatility.
What are Derivatives?
Financial contracts deriving value from underlying assets like stocks or indices. Futures and Options are the most common derivative types.
What are Call Options?
The right to buy an asset at a set price. Traders buy calls when they expect the market price to rise.

What are put Options?
The right to sell an asset at a specific price. Used to profit when the market price is expected to fall.
What is Large-Cap & Small Cap?
Large-caps are industry leaders with massive market value and stability. Small-caps are newer firms with high growth potential and higher risk.

Five golden rules of equity investment
1. Diversify assets. 2. Invest for long term. 3. Manage emotions. 4. Never follow tips blindly. 5. Always use stop loss setups.

What Is Technical Analysis?
The study of historical price and volume data using charts and technical indicators to forecast future market direction and entry points.

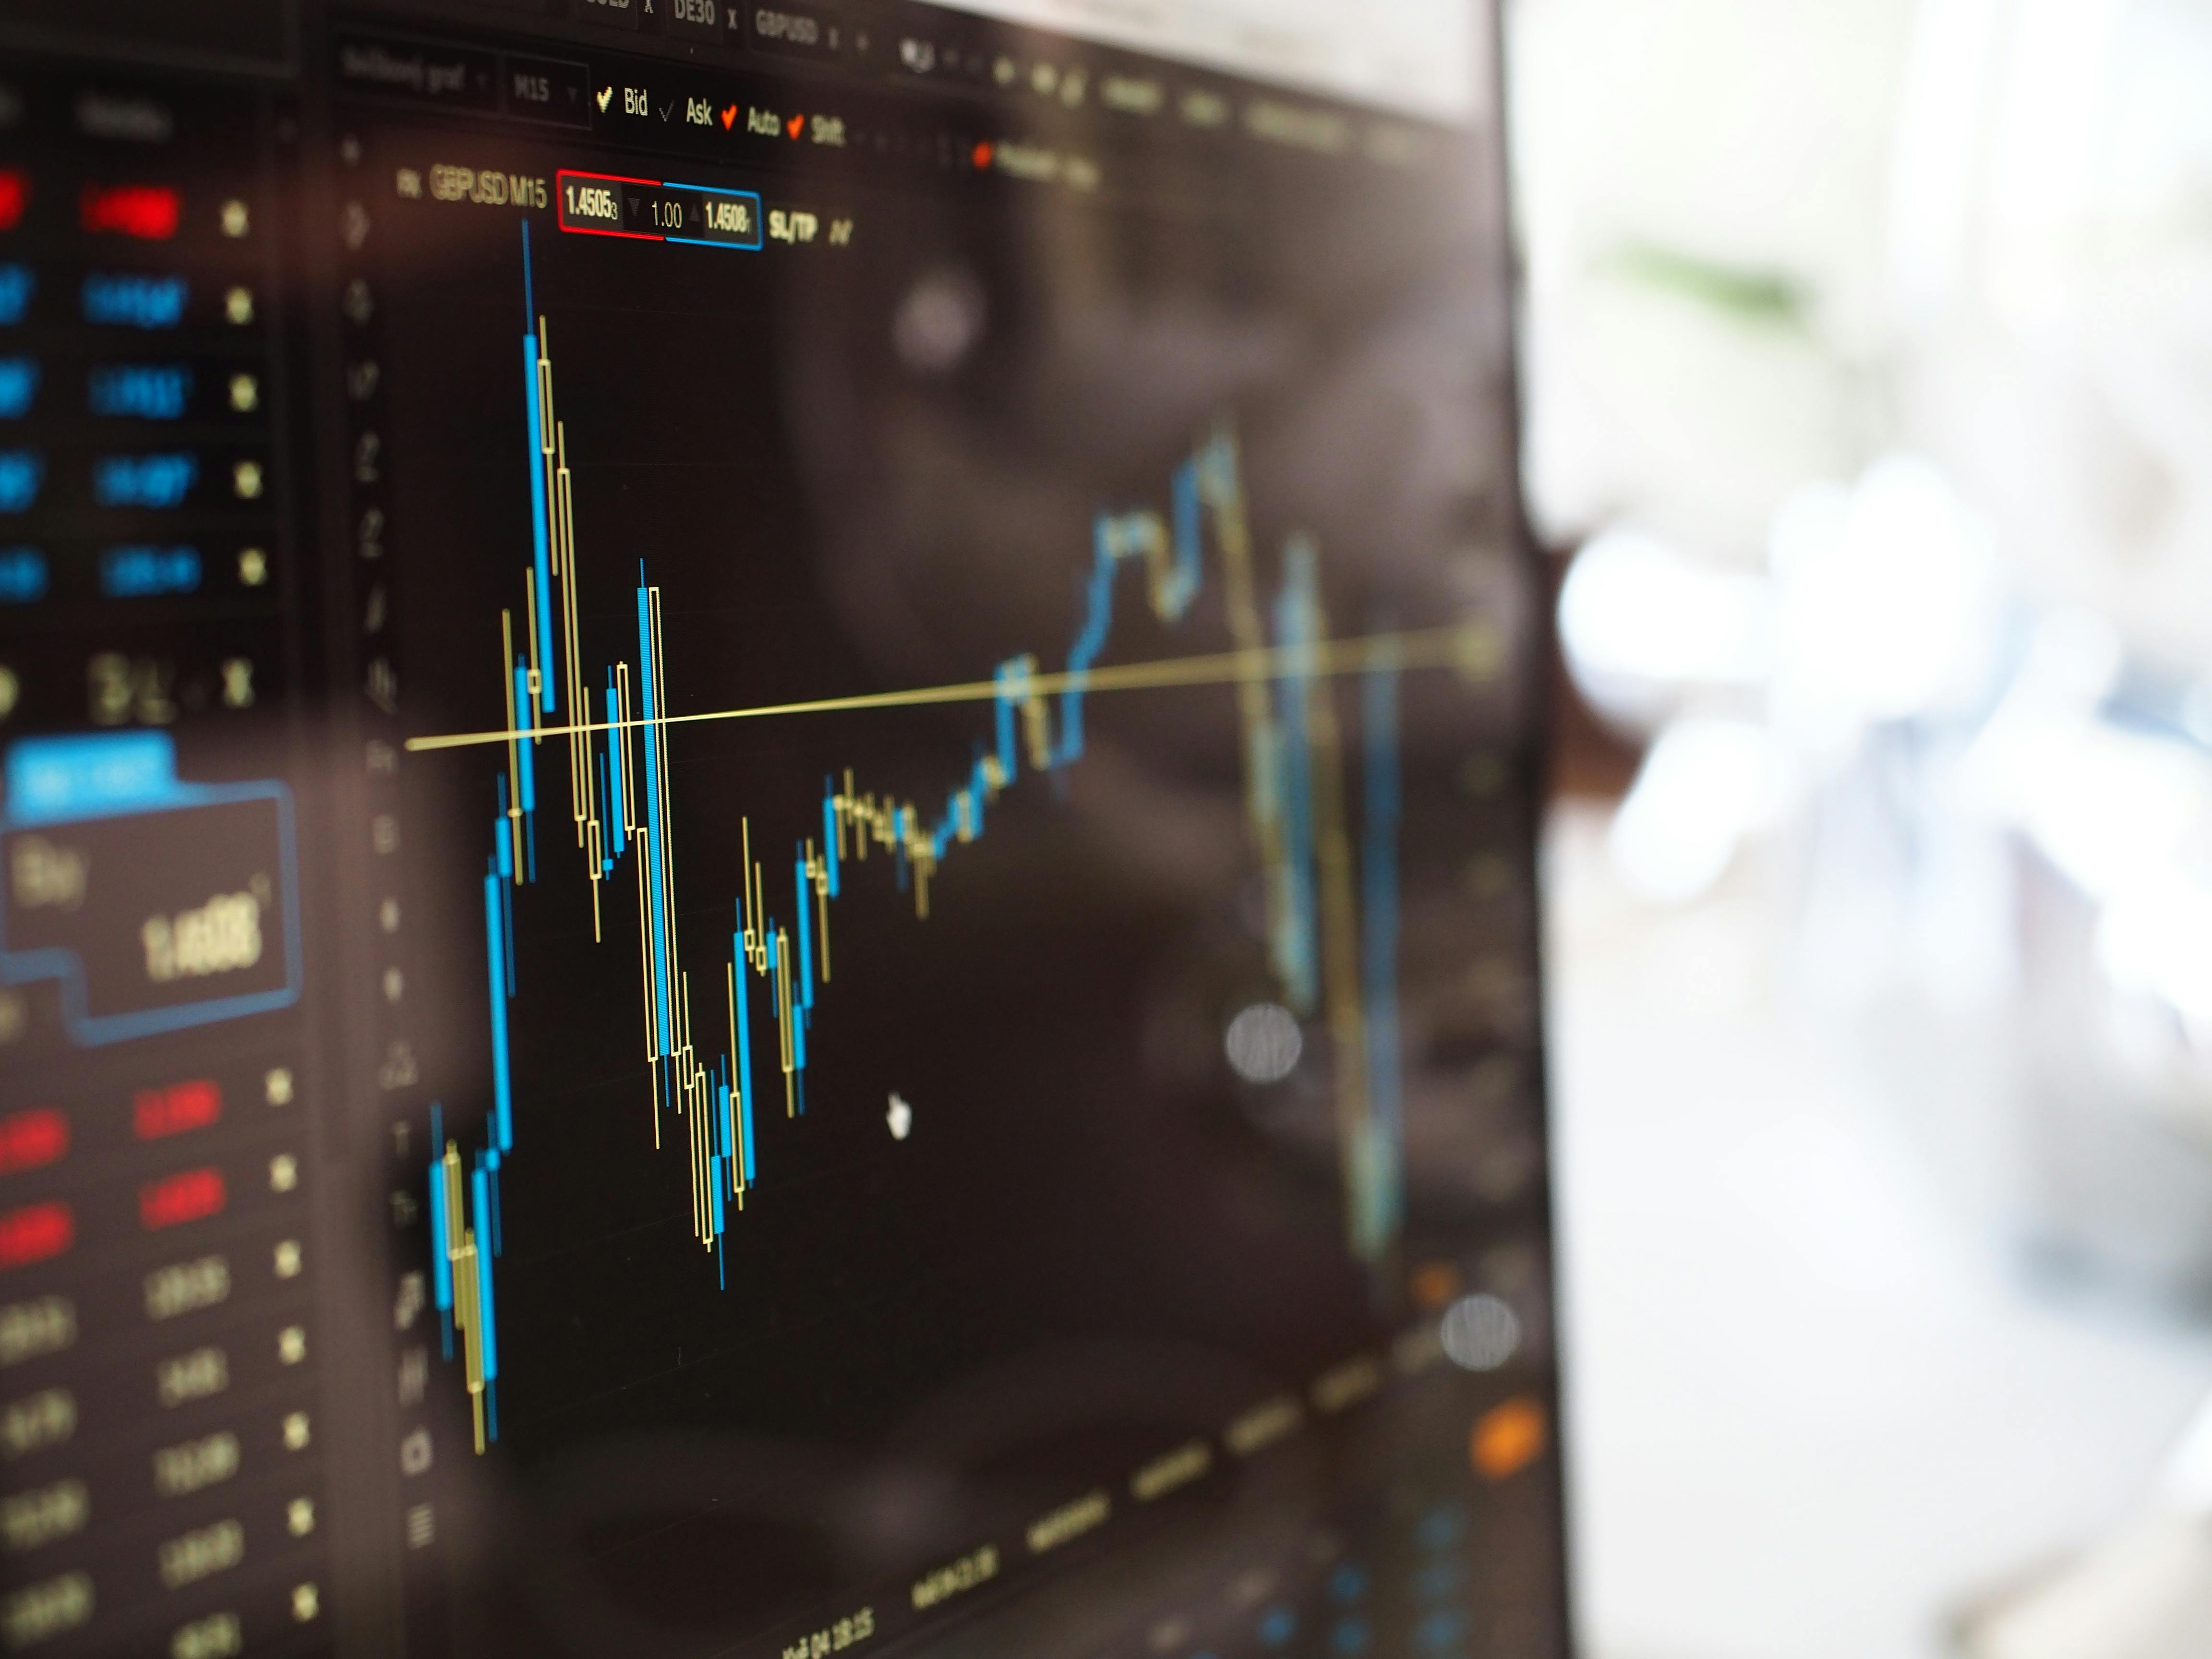
What Is Japanese Candlestick?
A visual chart pattern displaying the High, Low, Open, and Close prices for a period, helping identify market sentiment and reversals.

What Is Moving Averages?
Statistical indicators that smooth price data to create a constantly updated average price, helping traders identify trend directions.
What Is Pivot Points Levels?
Technical indicators used to determine key support and resistance levels based on the previous day's High, Low, and Closing prices.

What Is Bollinger Band?
A volatility indicator that uses standard deviation bands around a moving average to identify overbought and oversold market conditions.
What Is MACD Indicator?
Moving Average Convergence Divergence tracks momentum by showing the relationship between two moving averages of a security’s price.
What Is Parabolic SAR Indicator?
A trend-following indicator used to find potential reversals in price movement, shown as dots above or below price candles.
What Is Stochastic oscillator?
A momentum indicator comparing a closing price to a range of its prices over a period, indicating when a trend is losing strength.
What Is RSI Indicator?
Relative Strength Index measures the speed and change of price movements to identify overbought or oversold conditions on a 0-100 scale.
What Is ADX Indicator?
The Average Directional Index quantifies the strength of a trend. High values indicate a strong trend, while low values suggest a sideways market.
What Is Ichimoku Kinyo Hyo?
A comprehensive charting system that provides support/resistance, trend direction, and momentum signals all in one "cloud" indicator.